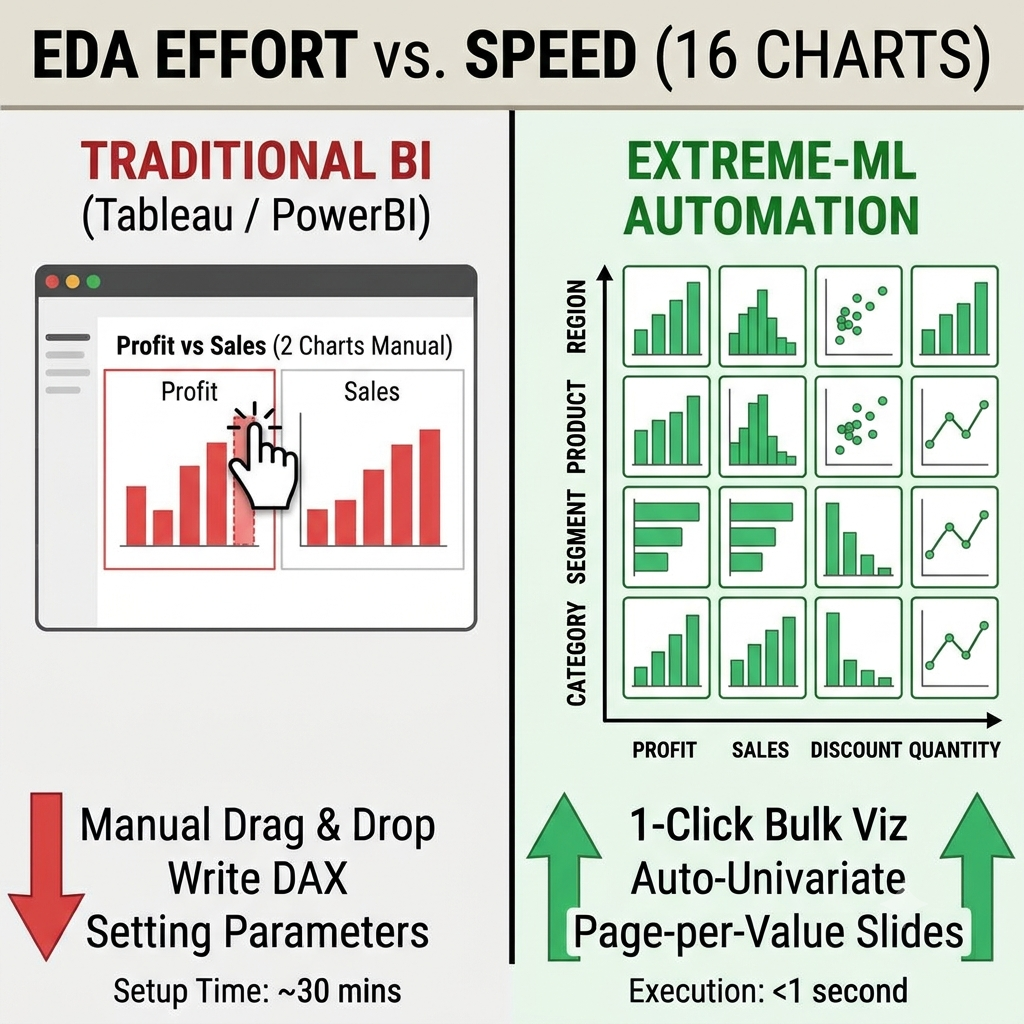
And How Extreme-ML Fixes It in 1 Click. If you build dashboards daily using traditional BI tools like Tableau or Power BI, you already know the frustration. When you need to analyze a fresh dataset with dozens of columns, you aren't just exploring data—you are stuck writing complex DAX measures, setting up dynamic parameters, dragging and dropping metrics 20 times, and wrestling with layout formatting. Traditional BI tools were designed to build polished, single-purpose dashboards. They were never built for fast, automated Exploratory Data Analysis (EDA). In our latest video walkthrough, we break down 10 core data visualization and exploration tasks that take forever in Tableau or Power BI—and show how they happen in 1 click, completely out-of-the-box, in Extreme-ML. ▶ Watch the full video demonstration on YouTube 1. Bulk Charting & Matrix Views The Concept: In traditional BI tools, plotting multiple metrics across multiple dimensions requires manual tile setup or complex parameters. In Extreme-ML, you simply select your X-axis fields and Y-axis metrics, and the system generates every individual chart in one unified view. Let's understand it through an example: Imagine you have a sales dataset with 4 key metrics (Discount, Profit, Sales, Quantity) and 8 categorical variables (Category, Sub-category, City, Country, Region, Segment, Ship Mode, State). To analyze these properly, you need 32 distinct charts ($4 \times 8$). In Tableau or Power BI, you would spend 20 minutes dragging, dropping, and configuring 32 individual visuals or writing DAX layout logic. How it works in Extreme-ML: You select the 4 metrics and the 8 variables, click Repeat for each metric and X-axis, and all 32 charts render automatically on your canvas without a single manual arrangement. (You can see this exact 32-chart generation live at the 2:40 mark in the video). 2. Page-per-Category Dashboard Repetition (Slide-Ready Reports) The Concept: Creating sliced reporting decks—where an entire multi-chart layout is repeated for every distinct entity (e.g., every region or bank)—is notoriously hard in standard BI tools without Report Builder extensions. Extreme-ML repeats the multi-chart dashboard for every category value and formats each slice into a clean, printer-friendly slide. Let's understand it through an example: Take an enterprise RBI banking dataset spanning 6 performance metrics (Cards in Force, Transactions, Purchase Value, Spend per Card, etc.) across 10 major banks (HDFC, SBI, ICICI, AXIS, AMEX, and others). You need a executive slide deck where each bank gets its own dedicated page showing its 6 performance charts. How it works in Extreme-ML: You select the metrics and click Repeat for each Bank. The system automatically builds a multi-page interactive layout. When you hit Ctrl + P to print or save to PDF, every single bank’s complete dashboard automatically maps onto its own crisp, landscape slide—giving you a 60-chart, 10-slide executive deck instantly. (Watch this slide-per-bank export in action at the 8:00 mark in the video). 3. Instant Top N / Bottom N Concentration Analysis The Concept: Ranking entities and computing their market share contribution usually requires custom rank formulas and cumulative totals. Extreme-ML calculates Top N / Bottom N performance, decimal formatting, and cumulative concentration percentages instantly out-of-the-box. Let's understand it through an example: Suppose you want to analyze banking performance strictly for September 2026 to find out which institutions dominate Cards in Force (CIF) and Purchase Value. How it works in Extreme-ML: You set a single date slice for September 2026, select Top 20, and the system instantly outputs formatted tables and charts showing: HDFC leading the market with 21.85% of total Card in Force. Top 4 Banks (HDFC, SBI, ICICI, AXIS) driving 69% of the entire market. Top 20 Banks capturing 97.55% market concentration (across 122 reporting banks). (See the Top N market concentration breakdown live at the 11:00 mark in the video). 4. Smart Auto-Univariate & Bivariate Profiling The Concept: Instead of forcing you to pick chart types manually (bar charts for text, histograms for numbers, box plots for distributions), the tool detects column data types automatically and selects the optimal visual profile. Let's understand it through an example: When you select a categorical variable like Category, Extreme-ML automatically generates count distributions and percentage bar charts. When you select a continuous numerical variable like Sales or Profit, it automatically renders histograms along with 1st, 25th, 50th, 85th, and 99th percentiles, negative counts, and outlier boundaries. For Bivariate Driver Analysis, it runs statistical feature interactions against a target variable (like "Default / Bad Loan Flag") and generates a structured table rating drivers as Major Driver, Significant, or Negligible. (Watch the automated Univariate and Bivariate profiling at the 13:30 mark in the video). 5. Segmented Distribution Plots & Dynamic Filtration The Concept: Comparing numerical metrics across geographic or demographic segments usually requires manual chart grouping. Extreme-ML generates interactive distribution plots (like Violin Plots) per segment in one click. Furthermore, every field in your data automatically becomes an active filter—complete with dynamic record-count waterfalls. Let's understand it through an example: Segmented Analysis: Comparing Loan Amount, Mortgage Due, and Home Value across regions (Midwest, Northwest, etc.) automatically generates interactive Violin Plots displaying mean lines, distributions, and outliers for each region on separate print-ready pages. Waterfall Record Filtering: Applying state or categorical filters instantly displays a live record waterfall (e.g., watching your dataset filter dynamically from 5,960 records down to 4,594 records with exact drop counts). External File Filtering: You can even upload a simple Notepad file containing target values to dynamically filter massive datasets on any field without writing SQL or DAX queries. (See the Violin plots and live Waterfall record filtering at the 17:10 mark in the video). The Bottom Line Everything highlighted here focuses strictly on layout automation, exploration speed, and zero-code efficiency. We haven't even touched Extreme-ML’s advanced statistical capabilities—such as automated column-wise trend coefficients and intercepts, row-level clustering, anomaly detection, or Benford’s Law for fraud detection! Tableau and Power BI are great for static dashboards, but when you need rapid, deep data discovery without writing Python scripts or endless DAX code, zero-code automation changes the game. Ready to see it in action? ▶ Watch the full video comparison on YouTube 🌐 Explore our zero-code analytics platforms at ProData Science Tags & Keywords #DataVisualization #Tableau #PowerBI #DataAnalytics #BusinessIntelligence #DataScience #ExtremeML #ZeroCode #AnalyticsAutomation Tableau alternatives for fast EDA Power BI automated chart generation Zero code exploratory data analysis Bulk charting in Tableau and Power BI Automated univariate bivariate analysis Page per category repeating dashboard PDF