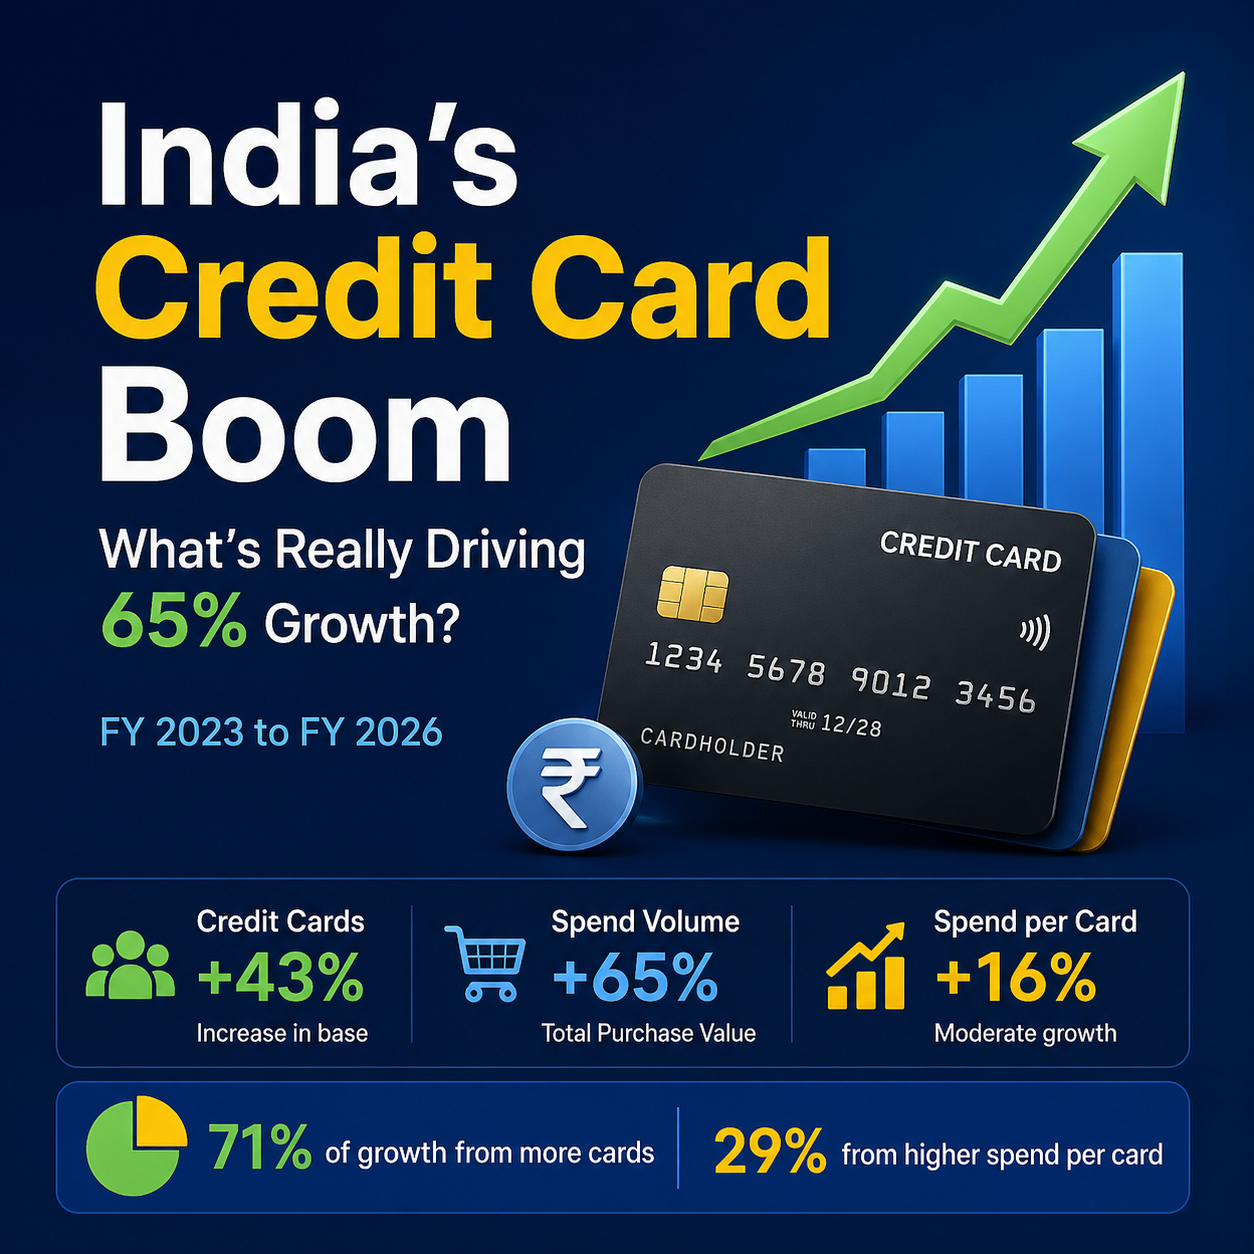
Volume vs. Value Drivers (FY23–FY26)
Indian Credit Card industry has seen phenomenal growth during post covid period. Let’s study the market dynamics from Apr 2022 till Mar 2026, which gives us four financial years. Below table exhibits the different financial year
| Financial Year | Start | End |
| FY 2023 | 1st Apr 2022 | 31st Mar 2023 |
| FY 2024 | 1st Apr 2023 | 31st Mar 2024 |
| FY 2025 | 1st Apr 2024 | 31st Mar 2025 |
| FY 2026 | 1st Apr 2025 | 31st Mar 2026 |
Below Table exhibits, Indian Credit card industry figure in last 4 financial years
| Industry Figure / month (representative average for the year) | |||
| FY | Avg No of Credit Cards (in Cr) per month | Total Credit Card Purchase Value (in Cr) per month | SPC (Spend per Card) |
| 2023 | 7.99 | 1,19,355 | 14,935 |
| 2024 | 9.40 | 1,52,595 | 16,239 |
| 2025 | 10.63 | 1,75,779 | 16,530 |
| 2026 | 11.40 | 1,96,873 | 17,272 |
This means, in 3 financial years, base figures (figures in FY 2023) of Credit Card Industry has
- 11.4/7.99 = 42.6% growth in number of credit cards
- 1,96,873/ 1,19,355 = 64.9% growth in purchase value (i.e. total amount spend on credit card by customers)
- 17,272 / 14,935 = 15.6% growth in Spend per card
- Please note spend growth = growth in number of Credit Card x Growth in spend / card
- Check 1.156 x 1.426 = 1.649
- How do you take out contribution of number of credit card and spend per card on final impact on spend volume?
- One can do it easily by taking log. This explains that
- Market volume growth is 71% impacted by growth in number of credit cards {71% ~log(1.426) / log(1.649)}
- And 29% impacted by growth in Spend per card {29% = log(1.156)/log(1.649)}
- The “Contribution” Summary: While overall spending is up 64.9%, nearly three-quarters of this growth (71%) is driven by the sheer influx of new cardholders, while only 29% comes from increased spending per individual
- In terms of CUGR –
- No of credit card has grown by 12.57%
- SPC has grown by 4.96%
- Purchase volume has grown by 18.15%
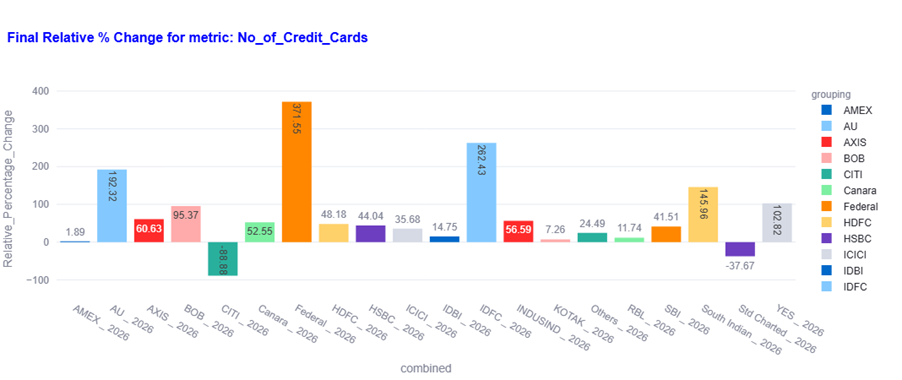
Now, let’s see the figures for other banks of India – first on Total Credit Card Purchase Value
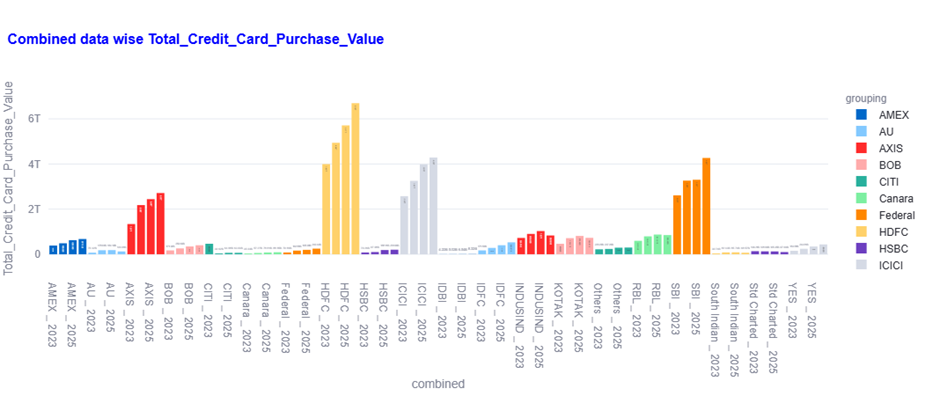
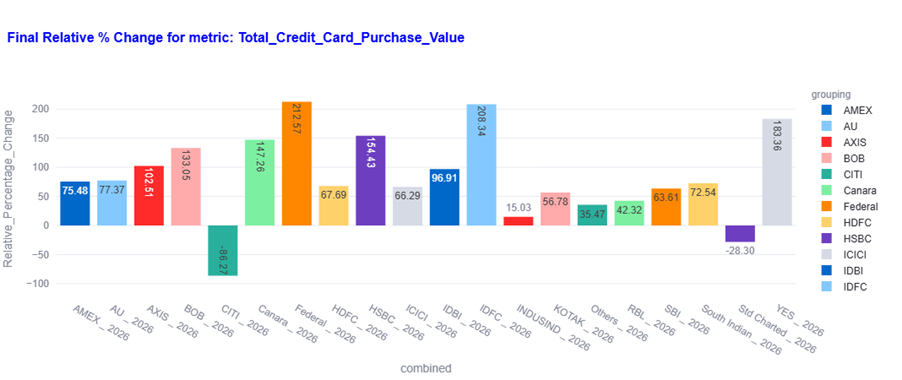
IDFC and Federal Bank as “high-growth challengers” (on purchase value metrics) that are successfully scaling their smaller bases at a much faster rate than the industry average. Most of the other big players like HDFC, ICICI, SBI (SBI Card) has seen that their Purchase value of financial year 2026 is 1.65-1.75 times of figure of FY 2023. Axis is market share gainer by consolidation” compared to the “organic growth” seen by HDFC or SBI.
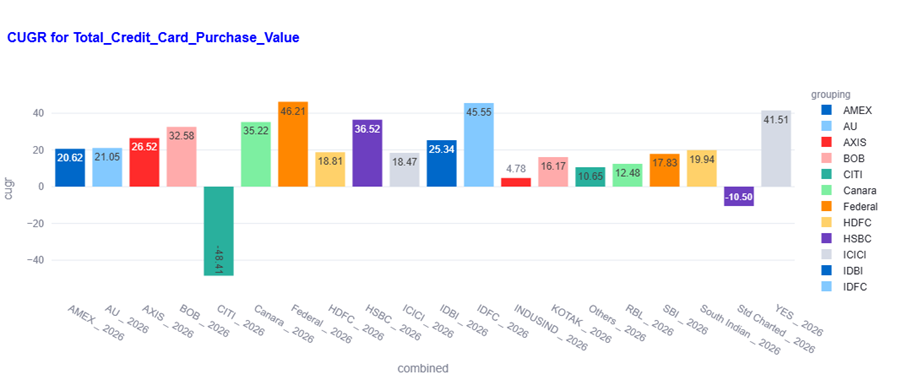
Clarification – CUGR stands for Cumulative Growth Rate. Extreme-ML, which has been used here, can be used to calculate monthly growth rate also. Hence it uses a generic name. But when it is done against yearly figures. It is CAGR only.
Now, let us see growth in average number of credit card for the financial year (average number of credit card in financial year has calculated by sum of number credit card for 12 months / 12)
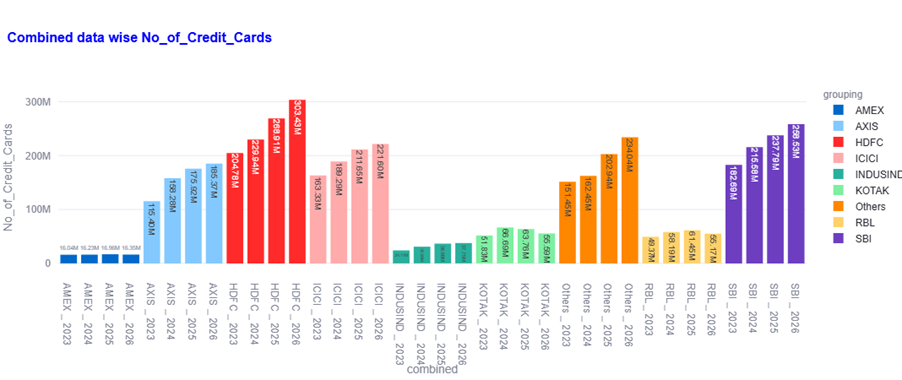
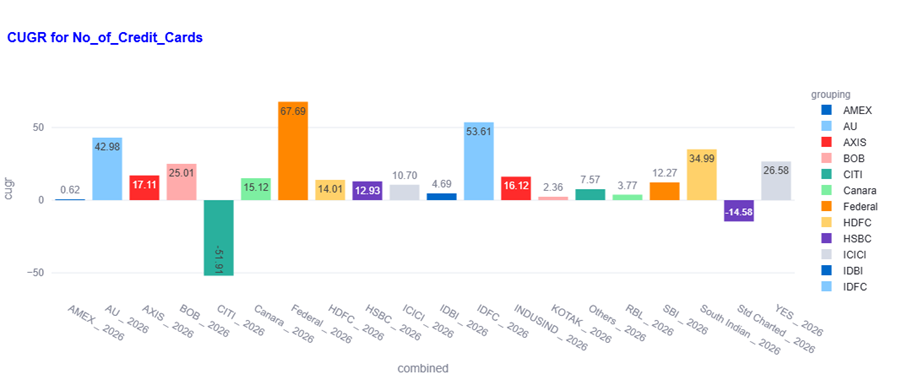
One can say with confidence that HDFC average base increased by 15.12% from it’s previous yearly average. For SBI Card, it is 12.27%. IDFC and Federal is again showing good acceleration.
Let us know focus on spend per card metrics.
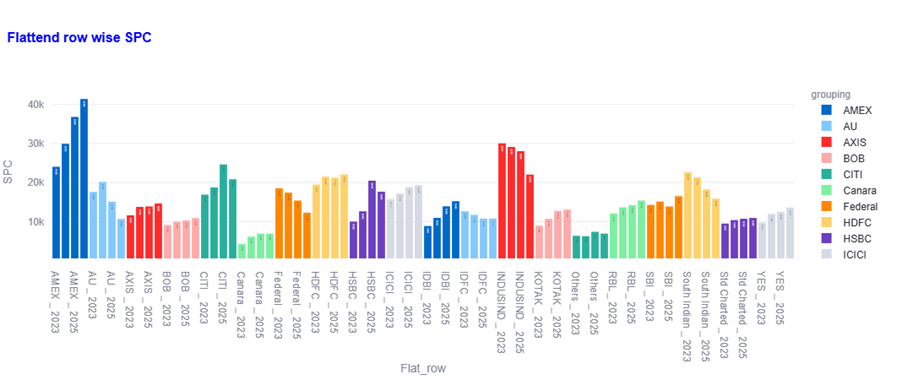
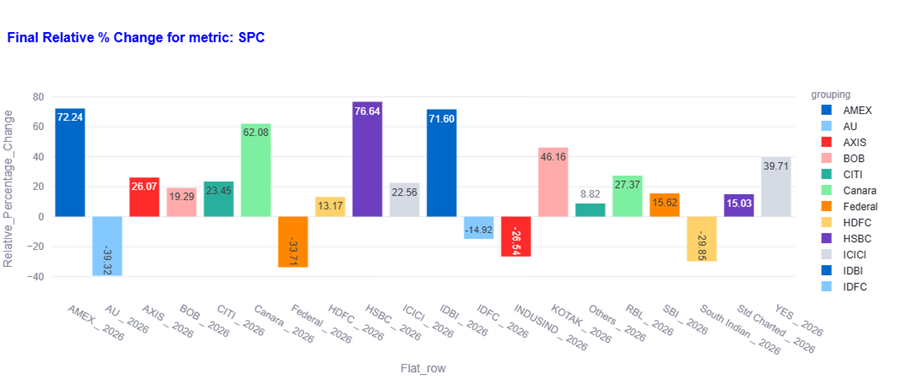
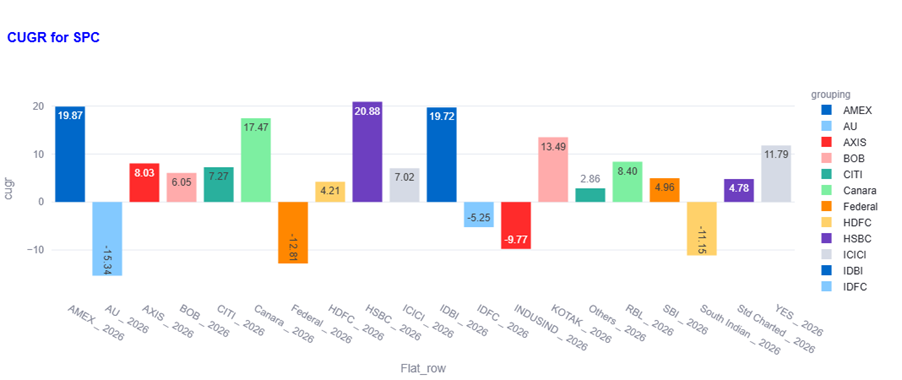
Spend per card is a slow moving figure, showing average increase in yearly average for big players like HDFC and SBI in the range of 4-5%, ICICI and AXIS in the range of 7-8%.
In summary,
Robust Industry Expansion: Industry has seen a 42.6% growth in the number of cards and a 64.9% surge in total purchase value over the three-year periodVolume-Led Growth: Market volume growth is primarily driven by the expanding card base (71% impact) rather than increased spending per indiv