Most common process followed / procedure used by Data scientists
#Datascience #DataMining
Most often a data scientist
Gets the data in to system (like SAS / R / Python etc.).
1. ==> By importing the data given (csv, Excel, pickle, txt etc. files) into system.
2. ==> Or by importing it from a database (Oracle, MySQL, SQLite , Hive etc.).
Joins the tables by a key field.
Sorts the data by key field
Drops duplicate values after joining.
At times, before joining the second table, data scientist just keeps count / maximum / sum / minimum / first / last value of variables from the table at key field level and then joins the tables.
Checks missing value for columns / Drops missing value records / columns or treats missing value records of a column.
Applies filter on rows of the data to get final data for analysis. At times keeps only few columns in the data, which are required for the job.
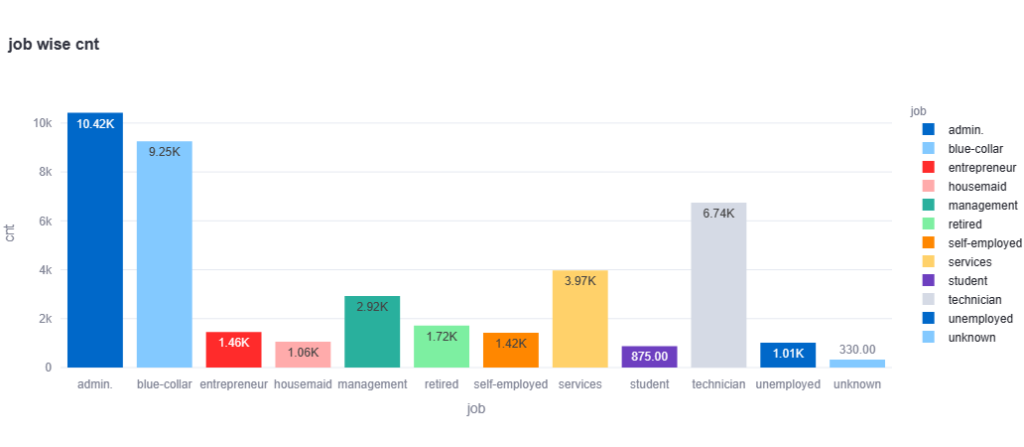
Finds Frequency distribution of categorical variables.
Does flooring / capping of different columns of the data if needed to get rid of outliers.
Checks trend / relationship –
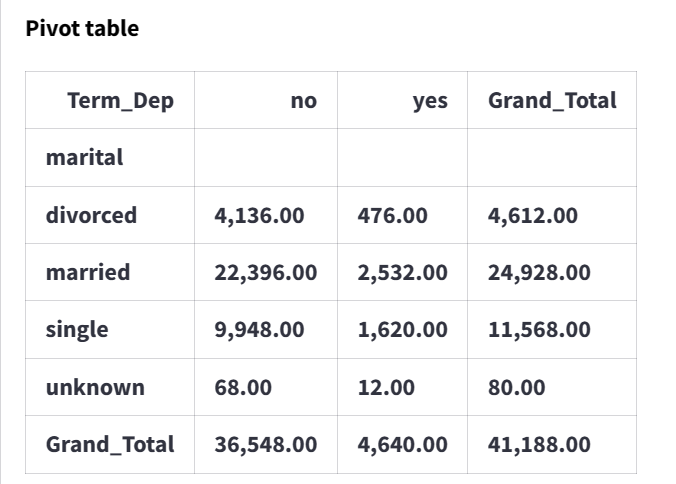
1. ==> for two categorical variable – it is usually achieved by making cross tab / contingency table
Cross Tab Table
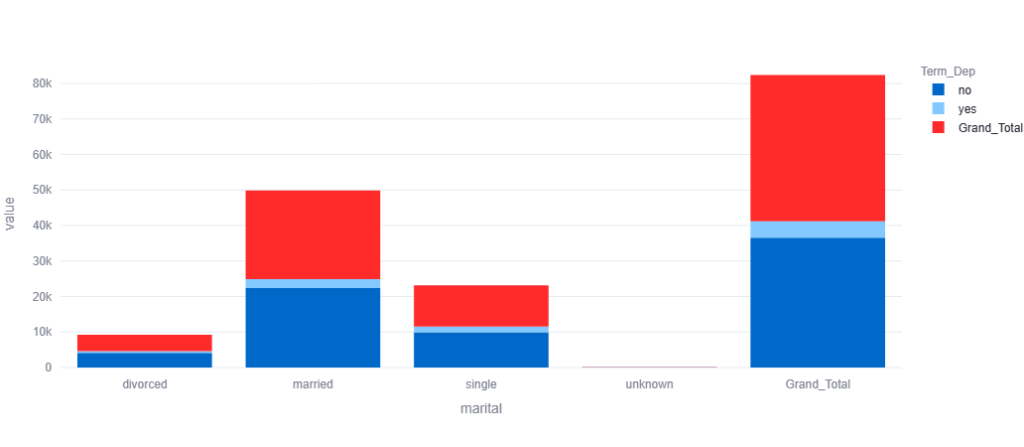
Cross Tab Visualization
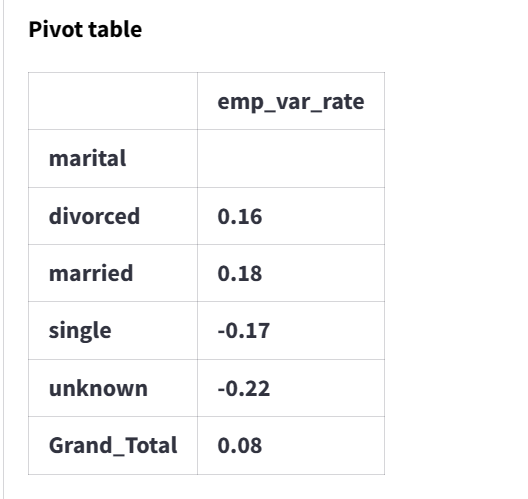
2. ==> for one categorical and one numeric variable – it is achieved by taking average of numeric variable for different values of categorical variable. An overlay chart of variables like distribution variable A in X-axis and size (count of records) on primary Y axis and put average of another variable on secondary Y-axis.
Average of numeric variable for different values of categorical variable
Visualization of Average of numeric variable for different values of categorical variable
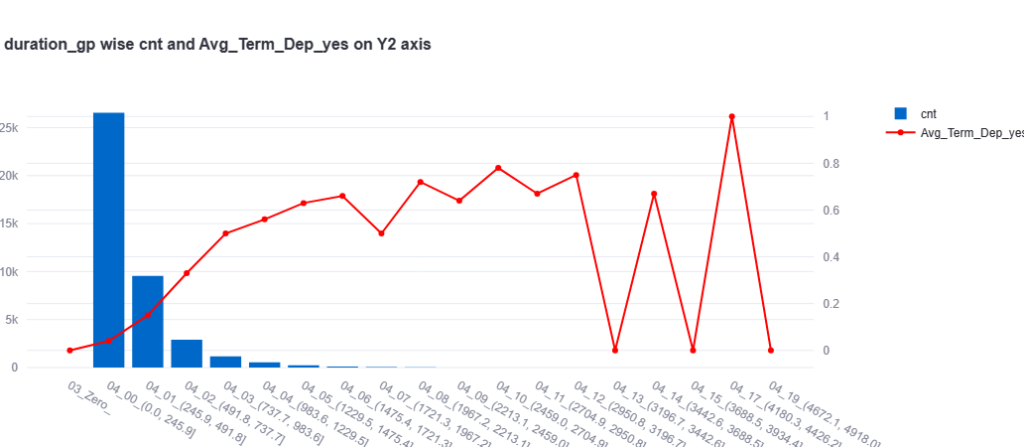
3. ==> For both numeric variable –One can see scatter plot to get an idea of relationship or Can create bins for one of the numeric variables and then plot it like bar chart (distribution variable A in X-axis and size (count of records) on primary Y axis) and put average of another variable on secondary Y-axis.
Group wise average of dependent variables
Scatter plot
Creates derived fields based on one / multiple columns.
Creates summary report and puts that into text file / Excel file with headers / titles.
At times, puts the summary data into a database (Oracle, SQLite etc.).